Office Market Outlook Q3 2020

Office Market at a glance, Q3 2020
Office market at a glance Q3 2020, Source: URA

Prices and Rentals

Prices of office space increased by 0.2% in 3rd Quarter 2020, compared with the 4.3% decrease in the previous quarter (see Annex A-1). Rentals of office space decreased by 4.5% in 3rd Quarter 2020, after remaining unchanged in the previous quarter (see Annexes A-3 & A-5).

Property Price Index of office space in Central Region

Office Price Index Central Region
Source: URA

Rental Index of office space in Central Region
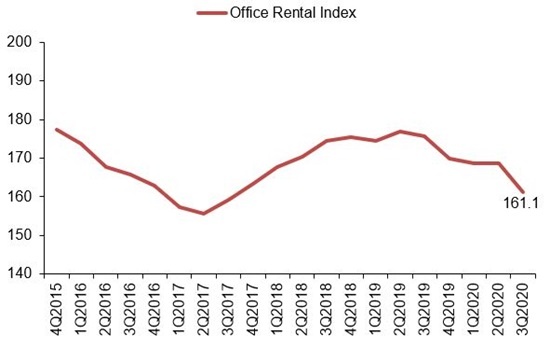
Office Rental Index Central Region
Source: URA

Supply in the Pipeline

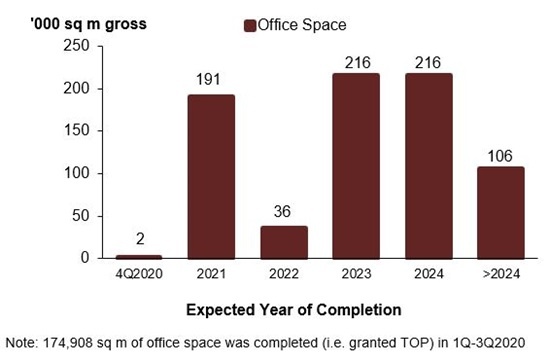
As at the end of 3rd Quarter 2020, there was a total supply of about 767,000 sq m GFA of office space in the pipeline, compared with the 668,000 sq m GFA of office space in the pipeline in the previous quarter (see Annexes E-1 & E-2).

Pipeline supply of office space

office-pipeline-q3-2020
Source: URA

Stock and Vacancy

The amount of occupied office space decreased by 19,000 sq m (nett) in 3rd Quarter 2020, compared with the decrease of 55,000 sq m (nett) in the previous quarter. The stock of office space decreased by 33,000 sq m (nett) in 3rd Quarter 2020, compared with the increase of 43,000 sq m (nett) in the previous quarter. As a result, the island-wide vacancy rate of office space decreased to 12.0% as at the end of 3rd Quarter 2020, from 12.1% as at the end of the previous quarter (see Annexes A-5 & E-1).

Stock and vacancy of office space
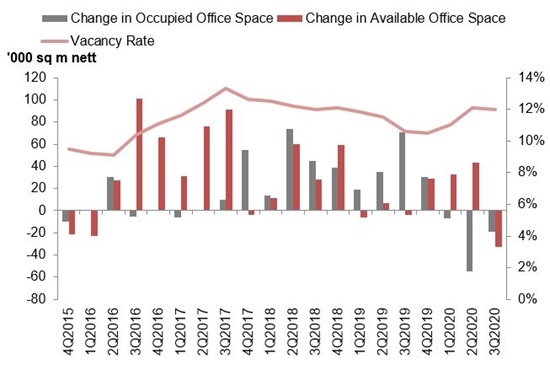
Office Space stock vs vacancy chart
Source: URA

Source of statistics and charts: URA

Our Conclusion

Despite the recession, we expect that office rents will likely continue to maintain near current rates for Q4 2020 as office vacancies are not on the rise.

Contact Us

We will love to hear from you! Drop us a note and we will get back to you!

error: Content is protected !!