Office Market Outlook Q2 2020

Office Market at a glance Q2 2020
Office market at a glance Q2 2020, Source: URA

Prices and Rentals

Prices of office space decreased by 4.3% in 2nd Quarter 2020, compared with the 4.0% decrease in the previous quarter (see Annex A-1). Rentals of office space remained unchanged in 2nd Quarter 2020, compared with the 0.8% decrease in the previous quarter (see Annexes A-3 & A-5).

Property Price Index of office space in Central Region
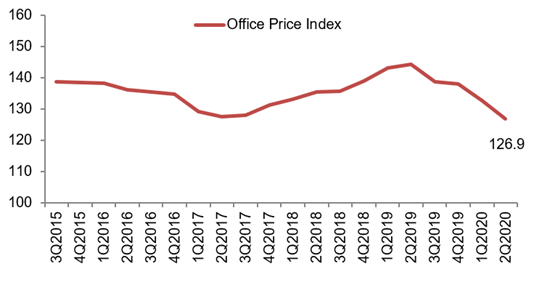
Office Price Index Q2 2020
Source: URA

Rental Index of office space in Central Region
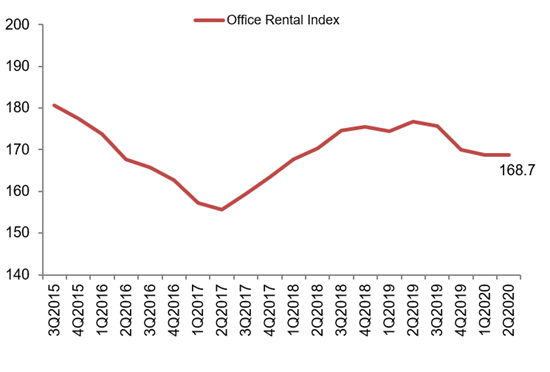
Office Rental Index Q2 2020
Source: URA

Supply in the Pipeline

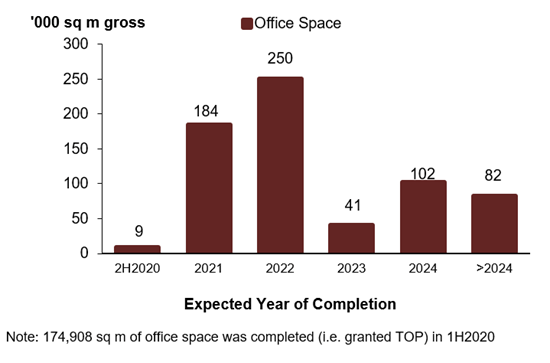
As at the end of 2nd Quarter 2020, there was a total supply of about 668,000 sq m GFA of office space in the pipeline, compared with the 682,000 sq m GFA of office space in the pipeline in the previous quarter (see Annexes E-1 & E-2).

Pipeline supply of office space

Office Space Supply 2020
Source: URA

Stock and Vacancy

The amount of occupied office space decreased by 55,000 sq m (nett) in 2nd Quarter 2020, compared with the decrease of 7,000 sq m (nett) in the previous quarter. The stock of office space increased by 43,000 sq m (nett) in 2nd Quarter 2020, compared with the increase of 33,000 sq m (nett) in the previous quarter. As a result, the island-wide vacancy rate of office space increased to 12.1% as at the end of 2nd Quarter 2020, from 11.0% as at the end of the previous quarter (see Annexes A-5 & E-1).

Stock and vacancy of office space
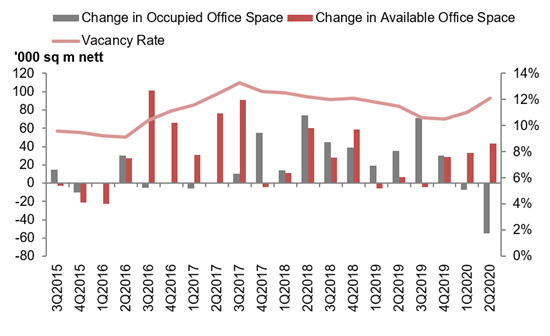
Office stock and vacancy chart Q2 2020
Source: URA

Source of statistics and charts: URA

Contact Us

We will love to hear from you! Drop us a note and we will get back to you!

error: Content is protected !!